
Crime statistics for any US address
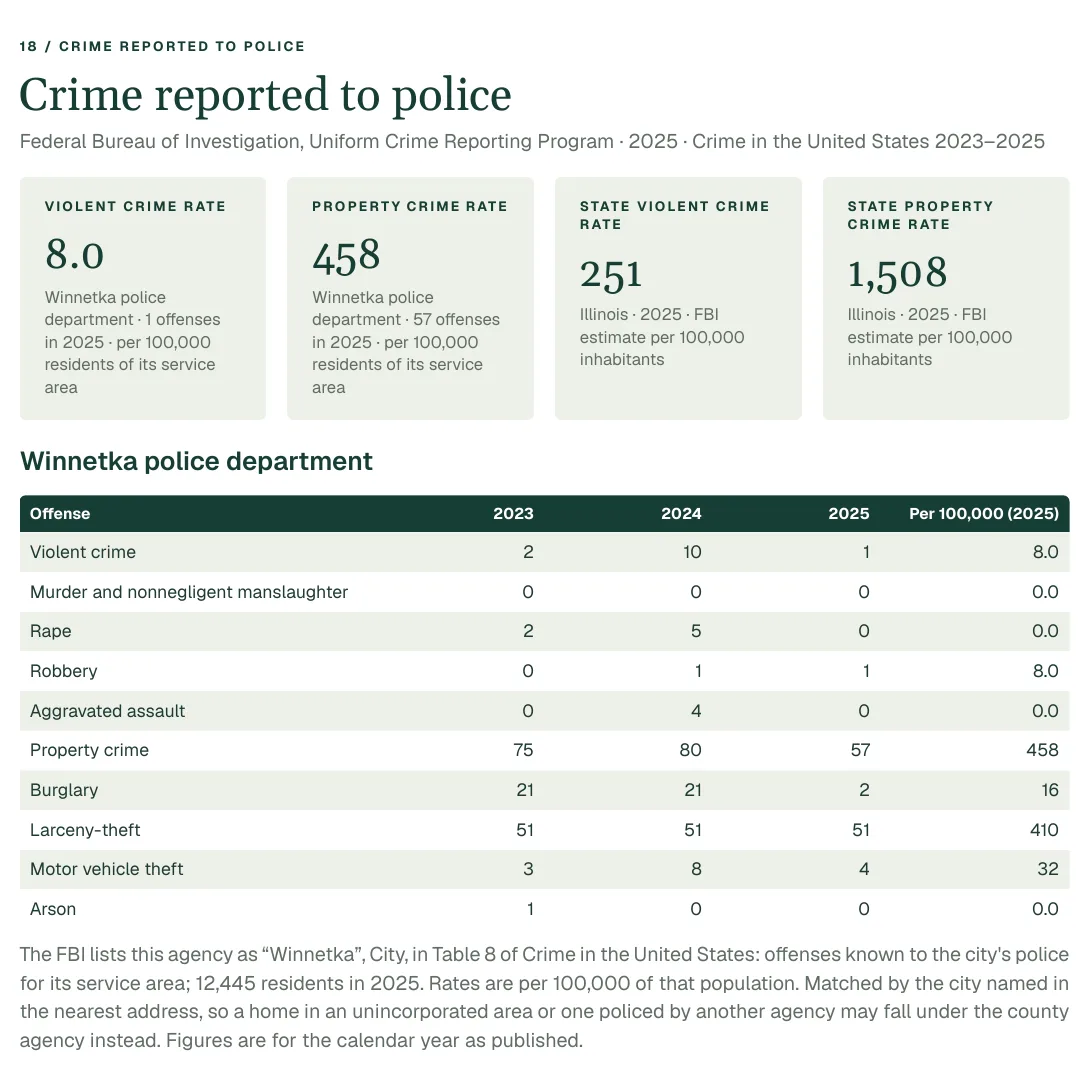
Neighbourhood safety is a top worry for buyers and the hardest thing to measure. The Property Location Report shows the offenses reported by the police agencies whose area the address falls in, from the FBI, with the state rate beside them.
US addresses only. Every figure names its source.
Why it matters when you buy
It is a number you can compare
Instead of an impression from a listing or a forum, you get the counts and, for cities, the rate per 100,000 residents published by the FBI, next to the state's rate.
Reported crime moves prices and insurance
Buyers weigh it, and so do the people you will sell to. Seeing it early lets you ask the right questions on a visit.
The honest limit is the geography
A police agency reports for its whole service area. Those figures say how the city or county agency fared, not what happened on a given street.
What the report shows
- Offenses known to the city police agency whose name matches the address's city, for the years 2023 to 2025, with the rate per 100,000 where the FBI published a population.
- The county agency's counts for the same years, shown separately and never added to the city's.
- The state estimate and its rate per 100,000 for comparison.
- The FBI's own table and row for each agency, so you can check the figures at the source.
Source: FBI, Crime in the United States. Offenses known to law enforcement, calendar years 2023 to 2025 as published: Table 8 for cities, Table 10 for county agencies and Table 5 for state estimates.
What it cannot tell you
- These are an agency's statistics, not a map of crime near the home. They are never phrased as a radius.
- A county agency shows counts and 'no rate': the FBI publishes a rate only where it has a population for the agency.
- A blank is 'not published', never zero. Reporting varies between agencies, and the FBI cautions against using these tables to rank places.
- The city agency is matched by the address's city name, so an unincorporated home may fall under the county agency instead.
Before you buy
The report is a starting point. These are the questions it points you to.
- 1How does the agency's rate compare with the state's?
- 2Ask the local police department for crime near the address and its trend.
- 3Visit at different times of day and talk to people who live on the street.
- 4Check whether the agency reported all months of the year in the FBI table.
Questions
Can I see crime on a map for an address?
Not from this report. The FBI publishes agency totals, not points on a map, so the report shows the city and county agency figures and says clearly that they are an agency's statistics.
Why is there no rate for some agencies?
The FBI publishes a rate per 100,000 only where it has a published population. A county agency shows counts and 'no rate'.
Which years does it cover?
Calendar years 2023 to 2025 as the FBI published them, labelled with the table and the agency's row.
More in the same report
Schools
The public schools nearest a US address with their distances on a map, and the school district the address falls in, from the National Center for Education Statistics.
Wildfire risk
How a US county ranks for wildfire risk and how many of its buildings are exposed, from USDA Wildfire Risk to Communities, plus the wildfire rating in FEMA's National Risk Index.
Flood zone
See the FEMA flood zone at a US address, how far the nearest Special Flood Hazard Area is, and what each zone means, on a map, from FEMA's National Flood Hazard Layer.
Also: Flood zone, Wildfire risk, Superfund sites, Wetlands, Schools.