
MapGO data study · November 11, 2026
ZIP codes that cross state lines
A ZIP code is not always inside one state. MapGO checked every Census ZIP code area in the 50 states and DC against the state lines: 127 of them reach 1% or more into a second state. In 71 the second state holds 10% of the area or more; in the other 56 it is a smaller edge. The most common pair is North Dakota – South Dakota, with 16 shared ZIP codes, and two ZIP codes reach into three states.
A Census ZIP Code Tabulation Area (ZCTA) is built from 2020 Census blocks, the smallest areas the Census counts. Each block goes to the ZIP code most of its addresses use, so where a post office serves homes on both sides of a state line, the ZIP code area does too. The ZIP code the Postal Service delivers to can differ from the Census area, and a share of 1 or 2% can be no more than a sliver along the line.
The map
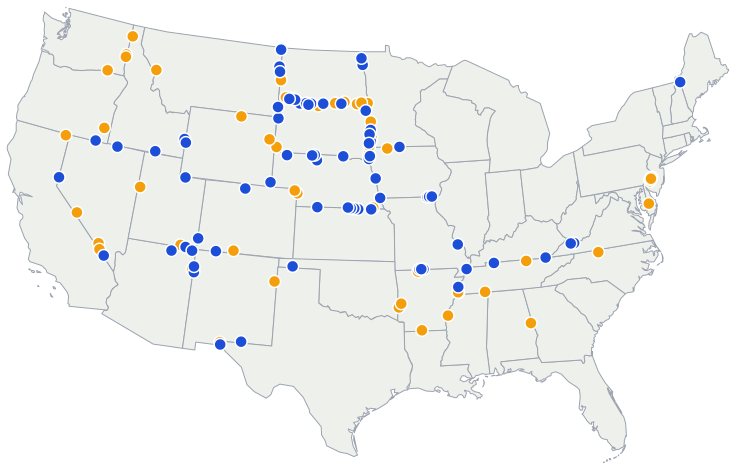
Many of them are on the rural Great Plains, where one post office can serve farms on both sides of a straight state line. South Dakota shares more ZIP codes with its neighbours than any other state: 36. Each dot is a point inside the ZIP code area. None of the ZIP codes is in Alaska or Hawaii.
Which states share the most ZIP codes
- 1. North Dakota – South Dakota16 ZIP codes
- 2. Kansas – Nebraska8 ZIP codes
- 3. Minnesota – South Dakota8 ZIP codes
- 4. New Jersey – Pennsylvania7 ZIP codes
- 5. Nebraska – South Dakota6 ZIP codes
- 6. California – Nevada5 ZIP codes
- 7. Arizona – Utah4 ZIP codes
- 8. Arkansas – Missouri4 ZIP codes
Which ZIP code, state and county is a point in?
In a ZIP code that crosses a state line, the ZIP code alone does not tell you the state. The free ZIP code map does: click a point or type a ZIP code to see its Census ZIP code area, with the state and county at that point.
All 127 ZIP codes
| 03579 | Maine 58.4%, New Hampshire 41.6% | 41.6% | Oxford County | 563 sq mi (1,457 km²) |
| 08063 | New Jersey 98.9%, Pennsylvania 1.1% | 1.1% | Gloucester County | 1.0 sq mi (2.6 km²) |
| 19114 | Pennsylvania 98.6%, New Jersey 1.4% | 1.4% | Philadelphia County | 5.6 sq mi (14.5 km²) |
| 19123 | Pennsylvania 98.7%, New Jersey 1.3% | 1.3% | Philadelphia County | 1.3 sq mi (3.4 km²) |
| 19125 | Pennsylvania 98.8%, New Jersey 1.2% | 1.2% | Philadelphia County | 1.4 sq mi (3.6 km²) |
| 19135 | Pennsylvania 98.4%, New Jersey 1.6% | 1.6% | Philadelphia County | 2.3 sq mi (6.0 km²) |
| 19136 | Pennsylvania 98.9%, New Jersey 1.1% | 1.1% | Philadelphia County | 4.8 sq mi (12.4 km²) |
| 19137 | Pennsylvania 98.4%, New Jersey 1.6% | 1.6% | Philadelphia County | 2.4 sq mi (6.2 km²) |
| 19973 | Delaware 92.8%, Maryland 7.2% | 7.2% | Sussex County | 84.0 sq mi (217.6 km²) |
| 24604 | Virginia 79.9%, West Virginia 20.1% | 20.1% | Tazewell County | 3.8 sq mi (9.8 km²) |
| 24622 | Virginia 87.4%, West Virginia 12.6% | 12.6% | Buchanan County | 54.1 sq mi (140.1 km²) |
| 27048 | North Carolina 98.6%, Virginia 1.4% | 1.4% | Rockingham County | 83.3 sq mi (215.7 km²) |
| 36855 | Alabama 98.9%, Georgia 1.1% | 1.1% | Chambers County | 72.0 sq mi (186.5 km²) |
| 38079 | Tennessee 87.1%, Kentucky 12.9% | 12.9% | Lake County | 111 sq mi (286 km²) |
| 38113 | Tennessee 97.3%, Arkansas 2.7% | 2.7% | Shelby County | 15.1 sq mi (39.1 km²) |
| 38326 | Tennessee 98.7%, Mississippi 1.3% | 1.3% | Hardin County | 42.6 sq mi (110.3 km²) |
| 38549 | Tennessee 98.2%, Kentucky 1.8% | 1.8% | Pickett County | 73.7 sq mi (190.9 km²) |
| 38769 | Mississippi 91.5%, Arkansas 8.5% | 8.5% | Bolivar County | 70.6 sq mi (182.9 km²) |
| 40965 | Kentucky 85.0%, Tennessee 15.0% | 15.0% | Bell County | 86.3 sq mi (223.5 km²) |
| 42223 | Tennessee 55.1%, Kentucky 44.9% | 44.9% | Montgomery County | 21.7 sq mi (56.2 km²) |
| 51001 | Iowa 60.2%, South Dakota 39.8% | 39.8% | Plymouth County | 165 sq mi (428 km²) |
| 51023 | Iowa 70.4%, South Dakota 29.6% | 29.6% | Sioux County | 120 sq mi (311 km²) |
| 51360 | Iowa 97.2%, Minnesota 2.8% | 2.8% | Dickinson County | 105 sq mi (272 km²) |
| 51557 | Iowa 89.2%, Nebraska 10.8% | 10.8% | Harrison County | 75.3 sq mi (195.0 km²) |
| 51640 | Iowa 81.6%, Missouri 18.4% | 18.4% | Fremont County | 115 sq mi (299 km²) |
| 52542 | Iowa 80.4%, Missouri 19.6% | 19.6% | Van Buren County | 46.8 sq mi (121.2 km²) |
| 52573 | Iowa 65.3%, Missouri 34.7% | 34.7% | Van Buren County | 37.3 sq mi (96.6 km²) |
| 52626 | Iowa 78.7%, Missouri 21.3% | 21.3% | Lee County | 88.2 sq mi (228.4 km²) |
| 56027 | Minnesota 86.6%, Iowa 13.4% | 13.4% | Faribault County | 63.3 sq mi (163.9 km²) |
| 56136 | Minnesota 77.6%, South Dakota 22.4% | 22.4% | Lincoln County | 114 sq mi (295 km²) |
| 56144 | Minnesota 86.9%, South Dakota 13.1% | 13.1% | Rock County | 120 sq mi (311 km²) |
| 56164 | Minnesota 96.6%, South Dakota 3.4% | 3.4% | Pipestone County | 241 sq mi (623 km²) |
| 56219 | South Dakota 55.1%, Minnesota 44.9% | 44.9% | Roberts County | 89.3 sq mi (231.3 km²) |
| 56257 | Minnesota 95.0%, South Dakota 5.0% | 5.0% | Lac qui Parle County | 92.1 sq mi (238.5 km²) |
| 56744 | Minnesota 73.2%, North Dakota 26.8% | 26.8% | Marshall County | 96.1 sq mi (248.9 km²) |
| 57026 | South Dakota 76.7%, Minnesota 23.3% | 23.3% | Brookings County | 178 sq mi (461 km²) |
| 57030 | South Dakota 90.0%, Minnesota 10.0% | 10.0% | Minnehaha County | 133 sq mi (344 km²) |
| 57034 | South Dakota 92.3%, Iowa 7.7% | 7.7% | Lincoln County | 76.3 sq mi (197.6 km²) |
| 57068 | South Dakota 93.2%, Minnesota 6.8% | 6.8% | Minnehaha County | 46.1 sq mi (119.4 km²) |
| 57255 | South Dakota 95.5%, North Dakota 4.5% | 4.5% | Roberts County | 104 sq mi (270 km²) |
| 57638 | South Dakota 65.2%, North Dakota 34.8% | 34.8% | Perkins County | 1,012 sq mi (2,622 km²) |
| 57641 | South Dakota 62.6%, North Dakota 37.4% | 37.4% | Corson County | 479 sq mi (1,241 km²) |
| 57642 | South Dakota 97.2%, North Dakota 2.8% | 2.8% | Corson County | 693 sq mi (1,796 km²) |
| 57645 | South Dakota 52.0%, North Dakota 48.0% | 48.0% | Corson County | 302 sq mi (782 km²) |
| 57648 | South Dakota 52.6%, North Dakota 47.4% | 47.4% | Campbell County | 237 sq mi (615 km²) |
| 57660 | South Dakota 88.0%, North Dakota 12.0% | 12.0% | Corson County | 198 sq mi (512 km²) |
| 57717 | South Dakota 74.8%, Wyoming 15.1%, Montana 10.1% | 15.1% | Butte County | 1,364 sq mi (3,534 km²) |
| 57724 | South Dakota 62.7%, Montana 37.3% | 37.3% | Harding County | 362 sq mi (937 km²) |
| 57735 | South Dakota 98.1%, Nebraska 1.9% | 1.9% | Fall River County | 905 sq mi (2,343 km²) |
| 58030 | North Dakota 98.7%, Minnesota 1.3% | 1.3% | Richland County | 131 sq mi (340 km²) |
| 58043 | North Dakota 95.1%, South Dakota 4.9% | 4.9% | Sargent County | 60.1 sq mi (155.7 km²) |
| 58053 | North Dakota 92.1%, South Dakota 7.9% | 7.9% | Richland County | 234 sq mi (607 km²) |
| 58225 | North Dakota 88.6%, Minnesota 11.4% | 11.4% | Pembina County | 234 sq mi (606 km²) |
| 58413 | North Dakota 93.4%, South Dakota 6.6% | 6.6% | McIntosh County | 492 sq mi (1,275 km²) |
| 58436 | North Dakota 95.4%, South Dakota 4.6% | 4.6% | Dickey County | 321 sq mi (830 km²) |
| 58439 | North Dakota 62.9%, South Dakota 37.1% | 37.1% | Dickey County | 186 sq mi (482 km²) |
| 58621 | North Dakota 95.6%, Montana 4.4% | 4.4% | Golden Valley County | 429 sq mi (1,110 km²) |
| 58623 | North Dakota 98.1%, South Dakota 1.9% | 1.9% | Bowman County | 541 sq mi (1,401 km²) |
| 58639 | North Dakota 78.8%, South Dakota 21.2% | 21.2% | Adams County | 570 sq mi (1,476 km²) |
| 58649 | North Dakota 90.5%, South Dakota 9.5% | 9.5% | Adams County | 255 sq mi (661 km²) |
| 58653 | North Dakota 85.4%, South Dakota 14.6% | 14.6% | Bowman County | 368 sq mi (952 km²) |
| 59221 | Montana 84.1%, North Dakota 15.9% | 15.9% | Richland County | 263 sq mi (680 km²) |
| 59270 | Montana 60.6%, North Dakota 39.4% | 39.4% | Richland County | 891 sq mi (2,308 km²) |
| 59275 | Montana 75.7%, North Dakota 24.3% | 24.3% | Sheridan County | 376 sq mi (975 km²) |
| 59847 | Montana 94.8%, Idaho 5.2% | 5.2% | Missoula County | 301 sq mi (780 km²) |
| 63673 | Missouri 78.4%, Illinois 21.6% | 21.6% | Ste. Genevieve County | 115 sq mi (298 km²) |
| 65729 | Missouri 89.2%, Arkansas 10.8% | 10.8% | Ozark County | 20.2 sq mi (52.3 km²) |
| 65733 | Missouri 81.1%, Arkansas 18.9% | 18.9% | Taney County | 65.0 sq mi (168.3 km²) |
| 65761 | Missouri 82.0%, Arkansas 18.0% | 18.0% | Ozark County | 115 sq mi (297 km²) |
| 66541 | Kansas 72.0%, Nebraska 28.0% | 28.0% | Marshall County | 50.0 sq mi (129.5 km²) |
| 66955 | Kansas 77.8%, Nebraska 22.2% | 22.2% | Washington County | 53.1 sq mi (137.5 km²) |
| 68325 | Nebraska 55.0%, Kansas 45.0% | 45.0% | Thayer County | 49.2 sq mi (127.4 km²) |
| 68327 | Nebraska 66.0%, Kansas 34.0% | 34.0% | Thayer County | 48.0 sq mi (124.3 km²) |
| 68420 | Nebraska 97.6%, Kansas 2.4% | 2.4% | Pawnee County | 130 sq mi (336 km²) |
| 68719 | Nebraska 60.1%, South Dakota 39.9% | 39.9% | Boyd County | 51.3 sq mi (132.9 km²) |
| 68943 | Nebraska 88.1%, Kansas 11.9% | 11.9% | Nuckolls County | 58.4 sq mi (151.3 km²) |
| 68978 | Nebraska 84.6%, Kansas 15.4% | 15.4% | Nuckolls County | 152 sq mi (394 km²) |
| 69026 | Nebraska 64.3%, Kansas 35.7% | 35.7% | Red Willow County | 79.1 sq mi (204.9 km²) |
| 69168 | Nebraska 95.6%, Colorado 4.4% | 4.4% | Perkins County | 147 sq mi (382 km²) |
| 69201 | Nebraska 83.3%, South Dakota 16.7% | 16.7% | Cherry County | 1,606 sq mi (4,158 km²) |
| 69212 | Nebraska 57.1%, South Dakota 42.9% | 42.9% | Cherry County | 239 sq mi (620 km²) |
| 69216 | Nebraska 70.9%, South Dakota 29.1% | 29.1% | Cherry County | 202 sq mi (523 km²) |
| 69337 | Nebraska 85.5%, South Dakota 14.5% | 14.5% | Dawes County | 775 sq mi (2,007 km²) |
| 71749 | Arkansas 98.2%, Louisiana 1.8% | 1.8% | Union County | 160 sq mi (414 km²) |
| 71937 | Arkansas 93.8%, Oklahoma 6.2% | 6.2% | Polk County | 81.4 sq mi (210.8 km²) |
| 71953 | Arkansas 94.9%, Oklahoma 5.1% | 5.1% | Polk County | 684 sq mi (1,771 km²) |
| 72301 | Arkansas 97.3%, Tennessee 2.7% | 2.7% | Crittenden County | 29.5 sq mi (76.4 km²) |
| 72338 | Tennessee 66.7%, Arkansas 33.3% | 33.3% | Tipton County | 35.1 sq mi (90.9 km²) |
| 72644 | Arkansas 98.8%, Missouri 1.2% | 1.2% | Boone County | 87.9 sq mi (227.7 km²) |
| 73949 | Oklahoma 86.4%, Texas 13.6% | 13.6% | Texas County | 452 sq mi (1,171 km²) |
| 79835 | Texas 98.8%, New Mexico 1.2% | 1.2% | El Paso County | 8.9 sq mi (23.1 km²) |
| 79837 | New Mexico 81.8%, Texas 18.2% | 18.2% | Otero County | 1,088 sq mi (2,817 km²) |
| 79922 | Texas 83.0%, New Mexico 17.0% | 17.0% | El Paso County | 8.1 sq mi (21.0 km²) |
| 80737 | Colorado 96.2%, Nebraska 3.8% | 3.8% | Sedgwick County | 250 sq mi (647 km²) |
| 81120 | Colorado 92.1%, New Mexico 7.9% | 7.9% | Conejos County | 894 sq mi (2,314 km²) |
| 81137 | Colorado 80.7%, New Mexico 19.3% | 19.3% | La Plata County | 258 sq mi (669 km²) |
| 81324 | Colorado 52.9%, Utah 47.1% | 47.1% | Dolores County | 430 sq mi (1,113 km²) |
| 82063 | Colorado 79.8%, Wyoming 20.2% | 20.2% | Larimer County | 351 sq mi (910 km²) |
| 82082 | Wyoming 70.7%, Nebraska 27.5%, Colorado 1.8% | 27.5% | Laramie County | 320 sq mi (829 km²) |
| 82701 | Wyoming 92.1%, South Dakota 7.9% | 7.9% | Weston County | 1,799 sq mi (4,658 km²) |
| 82801 | Wyoming 97.4%, Montana 2.6% | 2.6% | Sheridan County | 527 sq mi (1,364 km²) |
| 82930 | Utah 70.4%, Wyoming 29.6% | 29.6% | Summit County | 957 sq mi (2,477 km²) |
| 83120 | Idaho 90.0%, Wyoming 10.0% | 10.0% | Bonneville County | 137 sq mi (355 km²) |
| 83127 | Wyoming 52.2%, Idaho 47.8% | 47.8% | Lincoln County | 231 sq mi (599 km²) |
| 83342 | Idaho 86.7%, Utah 13.3% | 13.3% | Cassia County | 1,229 sq mi (3,183 km²) |
| 83856 | Idaho 92.0%, Washington 8.0% | 8.0% | Bonner County | 397 sq mi (1,028 km²) |
| 84034 | Utah 90.8%, Nevada 9.2% | 9.2% | Tooele County | 356 sq mi (922 km²) |
| 84531 | Utah 78.8%, Arizona 21.2% | 21.2% | San Juan County | 273 sq mi (707 km²) |
| 84536 | Utah 97.3%, Arizona 2.7% | 2.7% | San Juan County | 573 sq mi (1,485 km²) |
| 86044 | Arizona 68.5%, Utah 31.5% | 31.5% | Coconino County | 1,146 sq mi (2,968 km²) |
| 86504 | Arizona 98.7%, New Mexico 1.3% | 1.3% | Apache County | 202 sq mi (522 km²) |
| 86514 | Arizona 83.9%, Utah 15.1% | 15.1% | Apache County | 692 sq mi (1,793 km²) |
| 86515 | New Mexico 88.2%, Arizona 11.8% | 11.8% | McKinley County | 116 sq mi (299 km²) |
| 87328 | New Mexico 61.4%, Arizona 38.6% | 38.6% | Apache County | 353 sq mi (914 km²) |
| 88430 | New Mexico 97.3%, Texas 2.7% | 2.7% | Quay County | 446 sq mi (1,155 km²) |
| 89010 | Nevada 96.2%, California 3.8% | 3.8% | Esmeralda County | 384 sq mi (995 km²) |
| 89019 | Nevada 77.6%, California 22.4% | 22.4% | Clark County | 500 sq mi (1,294 km²) |
| 89060 | Nevada 98.1%, California 1.9% | 1.9% | Nye County | 449 sq mi (1,164 km²) |
| 89061 | Nevada 95.6%, California 4.4% | 4.4% | Nye County | 64.0 sq mi (165.8 km²) |
| 89421 | Oregon 61.1%, Nevada 38.9% | 38.9% | Malheur County | 928 sq mi (2,404 km²) |
| 89439 | Nevada 74.5%, California 25.5% | 25.5% | Washoe County | 16.3 sq mi (42.2 km²) |
| 89832 | Nevada 67.0%, Idaho 33.0% | 33.0% | Elko County | 175 sq mi (453 km²) |
| 97635 | California 92.8%, Oregon 7.2% | 7.2% | Modoc County | 52.1 sq mi (134.9 km²) |
| 97910 | Oregon 92.4%, Idaho 7.6% | 7.6% | Malheur County | 3,931 sq mi (10,182 km²) |
| 99033 | Washington 98.1%, Idaho 1.9% | 1.9% | Whitman County | 39.6 sq mi (102.6 km²) |
| 99128 | Washington 92.5%, Idaho 7.5% | 7.5% | Whitman County | 59.5 sq mi (154.1 km²) |
| 99362 | Washington 91.6%, Oregon 8.4% | 8.4% | Walla Walla County | 303 sq mi (785 km²) |
Click a heading to sort by it; click it again to reverse. A ZIP code opens it in the free lookup. Shares are of the whole ZIP code area, water included; the main county is the county holding most of it; land area leaves water out.
How it was measured
The ZIP code areas are the U.S. Census Bureau's 2020 ZIP Code Tabulation Areas (ZCTAs) for the 50 states and DC, the same data as MapGO's ZIP code lookup. The Census builds each one from 2020 Census blocks, giving every block to the ZIP code most of its addresses use. A ZIP code that is only PO boxes, or one large building, has no area and so cannot cross a line.
Each ZIP code area was cut along the Census Bureau's TIGER/Line state lines, and each piece measured on the curved earth. A state counts when it holds at least 1% of the ZIP code area; smaller pieces are left out, because the ZIP code areas and the state lines are drawn at slightly different detail and a tiny piece can be no more than that. The shares include water, so a ZIP code on a border river can reach the other bank by water alone.
A Census ZIP code area is not a postal delivery area, and the ZIP codes the Postal Service uses change more often than the Census redraws its areas. Measured by MapGO on November 11, 2026.
Questions
Can one ZIP code really be in two states?
Yes. ZIP codes follow mail delivery, not state lines. When one post office serves a rural area on both sides of a border, its ZIP code reaches into both states, and the Census ZIP code area built from it does too.
Is a Census ZIP code area the same as the ZIP code on my mail?
Not exactly. A ZIP Code Tabulation Area is the Census Bureau's picture of a ZIP code, made by giving each 2020 Census block to the ZIP code most of its addresses use. The Postal Service's delivery routes are lists of addresses, not areas, and they can differ, especially along the edges.
Why do some ZIP codes reach only 1% into the other state?
Small shares are often a sliver along the line: a few blocks on the far side of a river, or part of a lake or river counted with the ZIP code area. They are kept because the Census data says so, but read them as an edge, not as a town across the border. The table shows every share, so you can tell the two kinds apart.
Which state is a crossing ZIP code in for taxes or school?
That depends on the address, not the ZIP code. In a ZIP code that crosses a state line, two homes with the same ZIP code can be in different states. Look up the point itself: the free ZIP code lookup shows the state and county at the point you choose.
Can I download the ZIP code shapes?
Not from MapGO: ZIP code shapes are for use on MapGO's maps only. The CSV with this study has the figures and names. The shapes themselves are published free by the U.S. Census Bureau at census.gov.
Sources: U.S. Census Bureau, 2020 ZIP Code Tabulation Areas, and TIGER/Line state boundaries (public domain); state outlines on the map from Natural Earth. The CSV holds figures and names only, no ZIP code shapes. See also the other MapGO data studies.